|
Download Data (XLS File) |
|
|||||
|
|||||
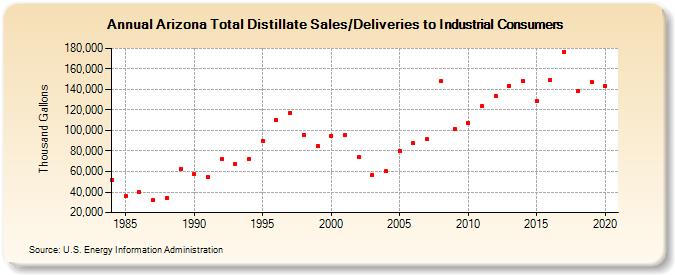
| Arizona Total Distillate Sales/Deliveries to Industrial Consumers (Thousand Gallons) | |||||
| Decade | Year-0 | Year-1 | Year-2 | Year-3 | Year-4 | Year-5 | Year-6 | Year-7 | Year-8 | Year-9 |
|---|---|---|---|---|---|---|---|---|---|---|
| 1980's | 52,060 | 36,233 | 39,779 | 32,124 | 34,487 | 62,315 | ||||
| 1990's | 57,107 | 54,476 | 72,538 | 67,056 | 72,424 | 89,912 | 110,277 | 117,481 | 95,658 | 84,957 |
| 2000's | 95,061 | 95,410 | 73,780 | 56,786 | 60,210 | 80,397 | 87,355 | 91,248 | 147,955 | 101,586 |
| 2010's | 107,474 | 123,554 | 133,361 | 143,435 | 148,458 | 128,249 | 149,586 | 176,337 | 138,402 | 147,281 |
| 2020's | 143,813 |
| - = No Data Reported; -- = Not Applicable; NA = Not Available; W = Withheld to avoid disclosure of individual company data. |
| Release Date: 2/9/2022 |
| Next Release Date: Suspended |