|
Download Data (XLS File) |
|
|||||
|
|||||
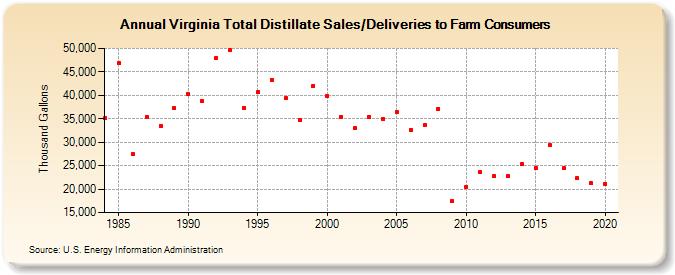
| Virginia Total Distillate Sales/Deliveries to Farm Consumers (Thousand Gallons) | |||||
| Decade | Year-0 | Year-1 | Year-2 | Year-3 | Year-4 | Year-5 | Year-6 | Year-7 | Year-8 | Year-9 |
|---|---|---|---|---|---|---|---|---|---|---|
| 1980's | 35,099 | 46,882 | 27,416 | 35,429 | 33,457 | 37,243 | ||||
| 1990's | 40,268 | 38,750 | 47,997 | 49,662 | 37,382 | 40,687 | 43,275 | 39,409 | 34,772 | 42,051 |
| 2000's | 39,824 | 35,370 | 32,970 | 35,458 | 34,922 | 36,490 | 32,616 | 33,607 | 37,123 | 17,422 |
| 2010's | 20,496 | 23,550 | 22,790 | 22,775 | 25,268 | 24,411 | 29,299 | 24,446 | 22,278 | 21,208 |
| 2020's | 21,182 |
| - = No Data Reported; -- = Not Applicable; NA = Not Available; W = Withheld to avoid disclosure of individual company data. |
| Release Date: 2/9/2022 |
| Next Release Date: Suspended |