|
Download Data (XLS File) |
|
|||||
|
|||||
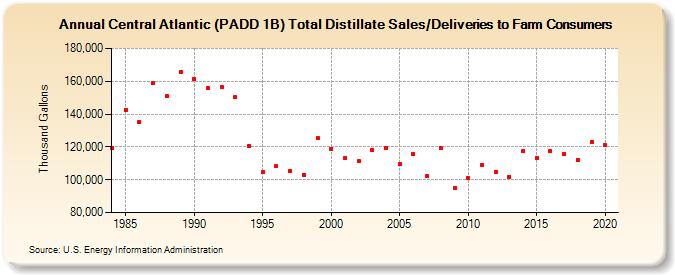
| Central Atlantic (PADD 1B) Total Distillate Sales/Deliveries to Farm Consumers (Thousand Gallons) | |||||
| Decade | Year-0 | Year-1 | Year-2 | Year-3 | Year-4 | Year-5 | Year-6 | Year-7 | Year-8 | Year-9 |
|---|---|---|---|---|---|---|---|---|---|---|
| 1980's | 119,084 | 142,645 | 135,319 | 159,009 | 150,822 | 165,860 | ||||
| 1990's | 161,052 | 155,839 | 156,326 | 150,326 | 120,722 | 104,672 | 108,154 | 105,328 | 103,046 | 125,148 |
| 2000's | 118,998 | 113,382 | 111,400 | 118,133 | 119,597 | 109,427 | 115,407 | 102,108 | 119,028 | 94,862 |
| 2010's | 101,211 | 108,924 | 104,831 | 101,832 | 117,297 | 113,388 | 117,594 | 115,776 | 112,216 | 123,138 |
| 2020's | 121,096 |
| - = No Data Reported; -- = Not Applicable; NA = Not Available; W = Withheld to avoid disclosure of individual company data. |
| Release Date: 2/9/2022 |
| Next Release Date: Suspended |