|
Download Data (XLS File) |
|
|||||
|
|||||
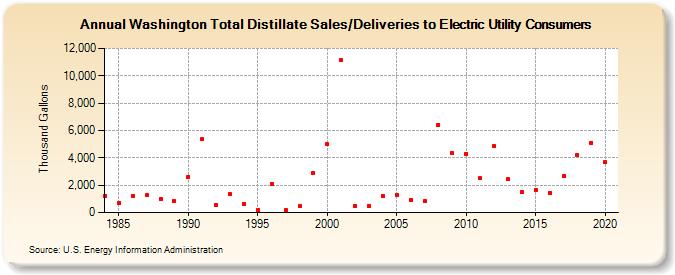
| Washington Total Distillate Sales/Deliveries to Electric Utility Consumers (Thousand Gallons) | |||||
| Decade | Year-0 | Year-1 | Year-2 | Year-3 | Year-4 | Year-5 | Year-6 | Year-7 | Year-8 | Year-9 |
|---|---|---|---|---|---|---|---|---|---|---|
| 1980's | 1,229 | 727 | 1,214 | 1,268 | 999 | 837 | ||||
| 1990's | 2,635 | 5,346 | 538 | 1,324 | 615 | 220 | 2,078 | 157 | 453 | 2,872 |
| 2000's | 4,983 | 11,124 | 488 | 483 | 1,177 | 1,318 | 925 | 817 | 6,427 | 4,332 |
| 2010's | 4,311 | 2,494 | 4,880 | 2,434 | 1,527 | 1,663 | 1,448 | 2,687 | 4,172 | 5,115 |
| 2020's | 3,674 |
| - = No Data Reported; -- = Not Applicable; NA = Not Available; W = Withheld to avoid disclosure of individual company data. |
| Release Date: 2/9/2022 |
| Next Release Date: Suspended |