|
Download Data (XLS File) |
|
|||||
|
|||||
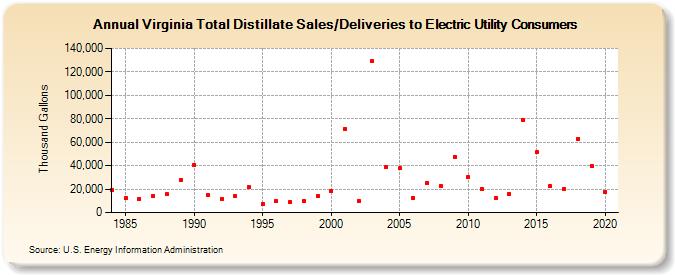
| Virginia Total Distillate Sales/Deliveries to Electric Utility Consumers (Thousand Gallons) | |||||
| Decade | Year-0 | Year-1 | Year-2 | Year-3 | Year-4 | Year-5 | Year-6 | Year-7 | Year-8 | Year-9 |
|---|---|---|---|---|---|---|---|---|---|---|
| 1980's | 19,521 | 12,530 | 11,892 | 14,013 | 15,509 | 27,883 | ||||
| 1990's | 40,401 | 14,626 | 11,780 | 13,848 | 21,957 | 7,231 | 9,831 | 8,930 | 10,177 | 14,473 |
| 2000's | 18,421 | 71,647 | 10,281 | 128,922 | 38,742 | 37,664 | 12,228 | 25,234 | 22,974 | 47,750 |
| 2010's | 30,160 | 20,335 | 12,621 | 15,965 | 78,754 | 51,218 | 22,398 | 20,349 | 62,820 | 39,982 |
| 2020's | 17,732 |
| - = No Data Reported; -- = Not Applicable; NA = Not Available; W = Withheld to avoid disclosure of individual company data. |
| Release Date: 2/9/2022 |
| Next Release Date: Suspended |