|
Download Data (XLS File) |
|
|||||
|
|||||
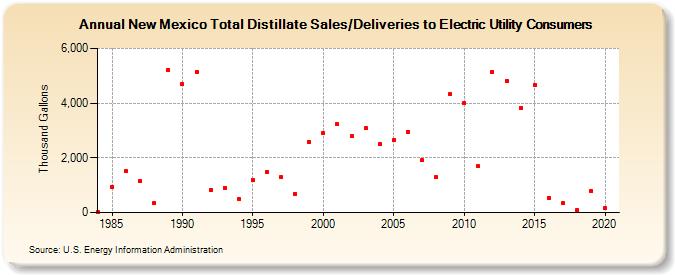
| New Mexico Total Distillate Sales/Deliveries to Electric Utility Consumers (Thousand Gallons) | |||||
| Decade | Year-0 | Year-1 | Year-2 | Year-3 | Year-4 | Year-5 | Year-6 | Year-7 | Year-8 | Year-9 |
|---|---|---|---|---|---|---|---|---|---|---|
| 1980's | 27 | 941 | 1,517 | 1,147 | 348 | 5,225 | ||||
| 1990's | 4,700 | 5,143 | 826 | 904 | 487 | 1,192 | 1,500 | 1,289 | 686 | 2,573 |
| 2000's | 2,903 | 3,222 | 2,785 | 3,074 | 2,492 | 2,651 | 2,952 | 1,911 | 1,286 | 4,321 |
| 2010's | 4,000 | 1,689 | 5,155 | 4,816 | 3,826 | 4,656 | 546 | 346 | 81 | 788 |
| 2020's | 160 |
| - = No Data Reported; -- = Not Applicable; NA = Not Available; W = Withheld to avoid disclosure of individual company data. |
| Release Date: 2/9/2022 |
| Next Release Date: Suspended |