|
Download Data (XLS File) |
|
|||||
|
|||||
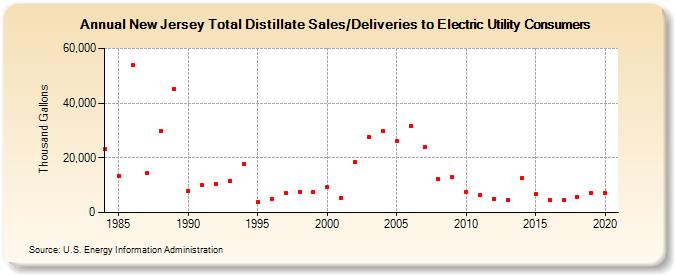
| New Jersey Total Distillate Sales/Deliveries to Electric Utility Consumers (Thousand Gallons) | |||||
| Decade | Year-0 | Year-1 | Year-2 | Year-3 | Year-4 | Year-5 | Year-6 | Year-7 | Year-8 | Year-9 |
|---|---|---|---|---|---|---|---|---|---|---|
| 1980's | 23,053 | 13,339 | 53,993 | 14,544 | 29,842 | 45,090 | ||||
| 1990's | 8,032 | 9,926 | 10,268 | 11,545 | 17,797 | 3,895 | 4,974 | 7,168 | 7,632 | 7,649 |
| 2000's | 9,179 | 5,420 | 18,415 | 27,780 | 29,952 | 25,987 | 31,736 | 24,095 | 12,200 | 12,847 |
| 2010's | 7,673 | 6,472 | 5,022 | 4,673 | 12,601 | 6,898 | 4,767 | 4,596 | 5,712 | 7,248 |
| 2020's | 7,315 |
| - = No Data Reported; -- = Not Applicable; NA = Not Available; W = Withheld to avoid disclosure of individual company data. |
| Release Date: 2/9/2022 |
| Next Release Date: Suspended |