|
Download Data (XLS File) |
|
|||||
|
|||||
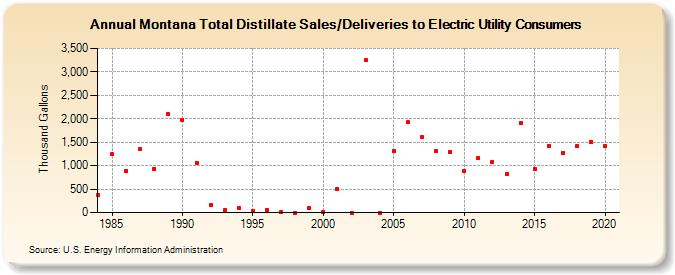
| Montana Total Distillate Sales/Deliveries to Electric Utility Consumers (Thousand Gallons) | |||||
| Decade | Year-0 | Year-1 | Year-2 | Year-3 | Year-4 | Year-5 | Year-6 | Year-7 | Year-8 | Year-9 |
|---|---|---|---|---|---|---|---|---|---|---|
| 1980's | 369 | 1,246 | 896 | 1,349 | 939 | 2,100 | ||||
| 1990's | 1,974 | 1,064 | 158 | 50 | 92 | 38 | 63 | 15 | 0 | 94 |
| 2000's | 17 | 497 | 0 | 3,242 | 0 | 1,316 | 1,930 | 1,603 | 1,315 | 1,301 |
| 2010's | 891 | 1,159 | 1,072 | 821 | 1,904 | 936 | 1,416 | 1,273 | 1,417 | 1,509 |
| 2020's | 1,412 |
| - = No Data Reported; -- = Not Applicable; NA = Not Available; W = Withheld to avoid disclosure of individual company data. |
| Release Date: 2/9/2022 |
| Next Release Date: Suspended |