|
Download Data (XLS File) |
|
|||||
|
|||||
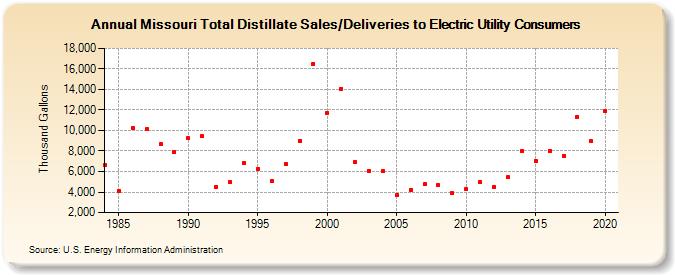
| Missouri Total Distillate Sales/Deliveries to Electric Utility Consumers (Thousand Gallons) | |||||
| Decade | Year-0 | Year-1 | Year-2 | Year-3 | Year-4 | Year-5 | Year-6 | Year-7 | Year-8 | Year-9 |
|---|---|---|---|---|---|---|---|---|---|---|
| 1980's | 6,603 | 4,143 | 10,219 | 10,104 | 8,635 | 7,915 | ||||
| 1990's | 9,235 | 9,479 | 4,514 | 4,966 | 6,873 | 6,293 | 5,102 | 6,733 | 9,009 | 16,523 |
| 2000's | 11,715 | 14,083 | 6,910 | 6,078 | 6,042 | 3,663 | 4,211 | 4,736 | 4,654 | 3,897 |
| 2010's | 4,266 | 4,959 | 4,510 | 5,429 | 8,008 | 7,039 | 8,028 | 7,541 | 11,306 | 8,940 |
| 2020's | 11,922 |
| - = No Data Reported; -- = Not Applicable; NA = Not Available; W = Withheld to avoid disclosure of individual company data. |
| Release Date: 2/9/2022 |
| Next Release Date: Suspended |