|
Download Data (XLS File) |
|
|||||
|
|||||
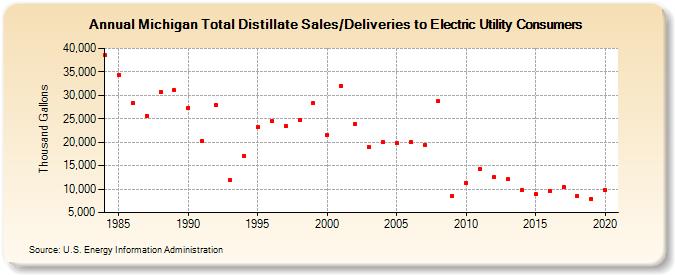
| Michigan Total Distillate Sales/Deliveries to Electric Utility Consumers (Thousand Gallons) | |||||
| Decade | Year-0 | Year-1 | Year-2 | Year-3 | Year-4 | Year-5 | Year-6 | Year-7 | Year-8 | Year-9 |
|---|---|---|---|---|---|---|---|---|---|---|
| 1980's | 38,535 | 34,313 | 28,337 | 25,663 | 30,715 | 31,072 | ||||
| 1990's | 27,384 | 20,251 | 27,924 | 11,928 | 17,050 | 23,238 | 24,541 | 23,436 | 24,720 | 28,294 |
| 2000's | 21,637 | 31,958 | 23,974 | 18,938 | 20,083 | 19,767 | 20,002 | 19,502 | 28,703 | 8,472 |
| 2010's | 11,289 | 14,269 | 12,521 | 12,075 | 9,819 | 8,952 | 9,688 | 10,412 | 8,495 | 7,923 |
| 2020's | 9,775 |
| - = No Data Reported; -- = Not Applicable; NA = Not Available; W = Withheld to avoid disclosure of individual company data. |
| Release Date: 2/9/2022 |
| Next Release Date: Suspended |