|
Download Data (XLS File) |
|
|||||
|
|||||
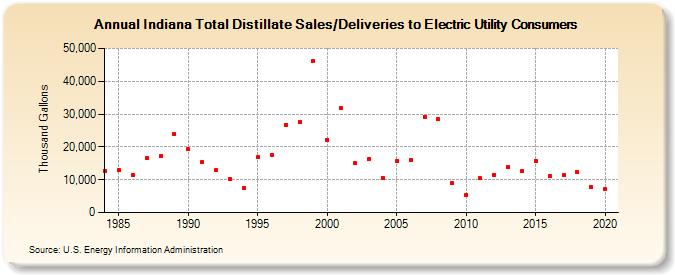
| Indiana Total Distillate Sales/Deliveries to Electric Utility Consumers (Thousand Gallons) | |||||
| Decade | Year-0 | Year-1 | Year-2 | Year-3 | Year-4 | Year-5 | Year-6 | Year-7 | Year-8 | Year-9 |
|---|---|---|---|---|---|---|---|---|---|---|
| 1980's | 12,676 | 12,869 | 11,299 | 16,480 | 17,145 | 23,953 | ||||
| 1990's | 19,223 | 15,282 | 12,972 | 10,075 | 7,421 | 16,839 | 17,663 | 26,752 | 27,544 | 46,077 |
| 2000's | 22,150 | 31,702 | 15,010 | 16,274 | 10,615 | 15,584 | 15,892 | 29,220 | 28,356 | 8,991 |
| 2010's | 5,423 | 10,377 | 11,442 | 13,866 | 12,633 | 15,807 | 11,090 | 11,331 | 12,254 | 7,701 |
| 2020's | 7,069 |
| - = No Data Reported; -- = Not Applicable; NA = Not Available; W = Withheld to avoid disclosure of individual company data. |
| Release Date: 2/9/2022 |
| Next Release Date: Suspended |