|
Download Data (XLS File) |
|
|||||
|
|||||
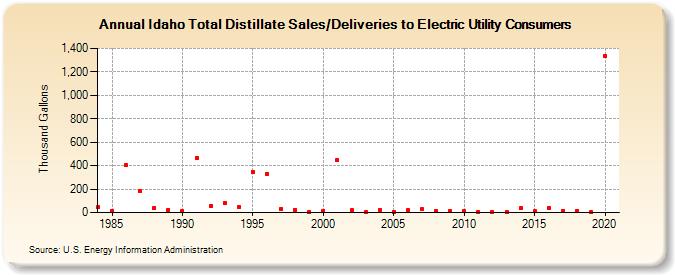
| Idaho Total Distillate Sales/Deliveries to Electric Utility Consumers (Thousand Gallons) | |||||
| Decade | Year-0 | Year-1 | Year-2 | Year-3 | Year-4 | Year-5 | Year-6 | Year-7 | Year-8 | Year-9 |
|---|---|---|---|---|---|---|---|---|---|---|
| 1980's | 45 | 17 | 403 | 181 | 43 | 22 | ||||
| 1990's | 13 | 465 | 58 | 81 | 51 | 350 | 333 | 33 | 25 | 9 |
| 2000's | 17 | 448 | 19 | 9 | 21 | 9 | 18 | 28 | 14 | 14 |
| 2010's | 11 | 5 | 4 | 4 | 37 | 11 | 41 | 14 | 17 | 2 |
| 2020's | 1,335 |
| - = No Data Reported; -- = Not Applicable; NA = Not Available; W = Withheld to avoid disclosure of individual company data. |
| Release Date: 2/9/2022 |
| Next Release Date: Suspended |