|
Download Data (XLS File) |
|
|||||
|
|||||
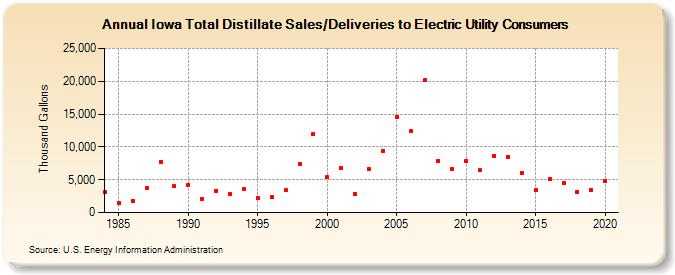
| Iowa Total Distillate Sales/Deliveries to Electric Utility Consumers (Thousand Gallons) | |||||
| Decade | Year-0 | Year-1 | Year-2 | Year-3 | Year-4 | Year-5 | Year-6 | Year-7 | Year-8 | Year-9 |
|---|---|---|---|---|---|---|---|---|---|---|
| 1980's | 3,167 | 1,531 | 1,806 | 3,758 | 7,762 | 3,975 | ||||
| 1990's | 4,241 | 2,100 | 3,312 | 2,844 | 3,548 | 2,183 | 2,357 | 3,362 | 7,466 | 11,950 |
| 2000's | 5,341 | 6,761 | 2,894 | 6,615 | 9,444 | 14,519 | 12,372 | 20,112 | 7,901 | 6,668 |
| 2010's | 7,923 | 6,453 | 8,587 | 8,516 | 6,005 | 3,407 | 5,133 | 4,441 | 3,197 | 3,417 |
| 2020's | 4,878 |
| - = No Data Reported; -- = Not Applicable; NA = Not Available; W = Withheld to avoid disclosure of individual company data. |
| Release Date: 2/9/2022 |
| Next Release Date: Suspended |