|
Download Data (XLS File) |
|
|||||
|
|||||
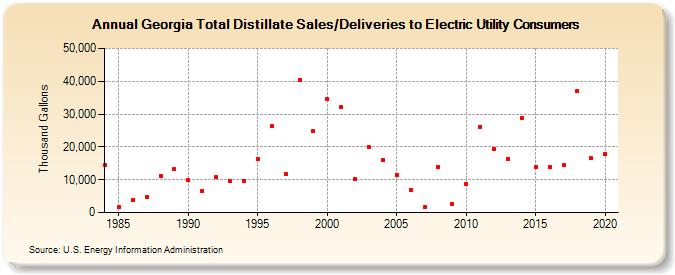
| Georgia Total Distillate Sales/Deliveries to Electric Utility Consumers (Thousand Gallons) | |||||
| Decade | Year-0 | Year-1 | Year-2 | Year-3 | Year-4 | Year-5 | Year-6 | Year-7 | Year-8 | Year-9 |
|---|---|---|---|---|---|---|---|---|---|---|
| 1980's | 14,598 | 1,639 | 3,731 | 4,687 | 11,260 | 13,291 | ||||
| 1990's | 9,817 | 6,640 | 10,834 | 9,575 | 9,762 | 16,270 | 26,214 | 11,686 | 40,377 | 24,740 |
| 2000's | 34,454 | 32,033 | 10,335 | 19,849 | 16,154 | 11,534 | 6,995 | 1,557 | 13,874 | 2,511 |
| 2010's | 8,812 | 26,177 | 19,412 | 16,448 | 28,905 | 13,861 | 13,800 | 14,452 | 37,051 | 16,473 |
| 2020's | 17,922 |
| - = No Data Reported; -- = Not Applicable; NA = Not Available; W = Withheld to avoid disclosure of individual company data. |
| Release Date: 2/9/2022 |
| Next Release Date: Suspended |