|
Download Data (XLS File) |
|
|||||
|
|||||
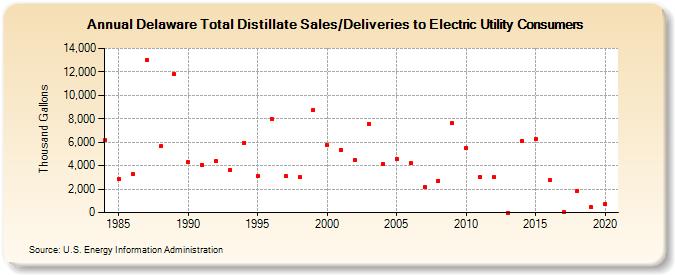
| Delaware Total Distillate Sales/Deliveries to Electric Utility Consumers (Thousand Gallons) | |||||
| Decade | Year-0 | Year-1 | Year-2 | Year-3 | Year-4 | Year-5 | Year-6 | Year-7 | Year-8 | Year-9 |
|---|---|---|---|---|---|---|---|---|---|---|
| 1980's | 6,151 | 2,841 | 3,263 | 13,025 | 5,635 | 11,774 | ||||
| 1990's | 4,300 | 4,085 | 4,366 | 3,670 | 5,919 | 3,118 | 8,016 | 3,105 | 3,023 | 8,741 |
| 2000's | 5,725 | 5,371 | 4,456 | 7,591 | 4,165 | 4,582 | 4,194 | 2,166 | 2,715 | 7,619 |
| 2010's | 5,530 | 3,028 | 3,030 | 0 | 6,117 | 6,236 | 2,753 | 23 | 1,868 | 448 |
| 2020's | 748 |
| - = No Data Reported; -- = Not Applicable; NA = Not Available; W = Withheld to avoid disclosure of individual company data. |
| Release Date: 2/9/2022 |
| Next Release Date: Suspended |