|
Download Data (XLS File) |
|
|||||
|
|||||
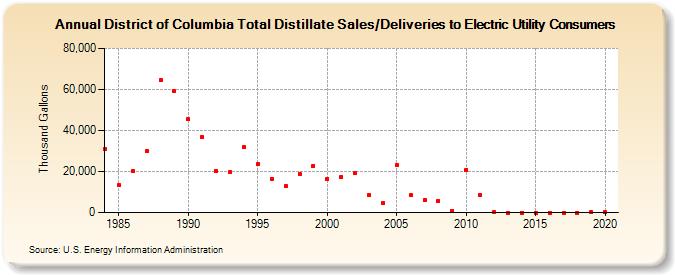
| District of Columbia Total Distillate Sales/Deliveries to Electric Utility Consumers (Thousand Gallons) | |||||
| Decade | Year-0 | Year-1 | Year-2 | Year-3 | Year-4 | Year-5 | Year-6 | Year-7 | Year-8 | Year-9 |
|---|---|---|---|---|---|---|---|---|---|---|
| 1980's | 31,181 | 13,194 | 20,313 | 29,811 | 64,553 | 59,210 | ||||
| 1990's | 45,465 | 36,765 | 20,315 | 19,532 | 31,825 | 23,567 | 16,587 | 12,785 | 18,818 | 22,854 |
| 2000's | 16,552 | 17,406 | 19,246 | 8,386 | 4,888 | 23,186 | 8,480 | 6,078 | 5,633 | 902 |
| 2010's | 20,804 | 8,537 | 329 | 0 | 0 | 0 | 0 | 0 | 8 | 142 |
| 2020's | 156 |
| - = No Data Reported; -- = Not Applicable; NA = Not Available; W = Withheld to avoid disclosure of individual company data. |
| Release Date: 2/9/2022 |
| Next Release Date: Suspended |