|
Download Data (XLS File) |
|
|||||
|
|||||
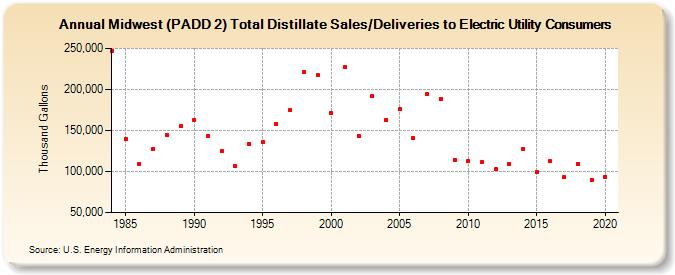
| Midwest (PADD 2) Total Distillate Sales/Deliveries to Electric Utility Consumers (Thousand Gallons) | |||||
| Decade | Year-0 | Year-1 | Year-2 | Year-3 | Year-4 | Year-5 | Year-6 | Year-7 | Year-8 | Year-9 |
|---|---|---|---|---|---|---|---|---|---|---|
| 1980's | 246,520 | 139,882 | 109,351 | 127,744 | 144,946 | 154,963 | ||||
| 1990's | 162,609 | 143,301 | 125,049 | 106,144 | 133,845 | 135,966 | 158,398 | 174,601 | 220,686 | 217,128 |
| 2000's | 171,458 | 226,916 | 143,793 | 191,911 | 163,258 | 175,651 | 140,577 | 194,185 | 188,824 | 114,626 |
| 2010's | 112,488 | 111,512 | 102,813 | 109,228 | 127,887 | 99,653 | 112,466 | 92,883 | 109,547 | 90,005 |
| 2020's | 93,871 |
| - = No Data Reported; -- = Not Applicable; NA = Not Available; W = Withheld to avoid disclosure of individual company data. |
| Release Date: 2/9/2022 |
| Next Release Date: Suspended |