|
Download Data (XLS File) |
|
|||||
|
|||||
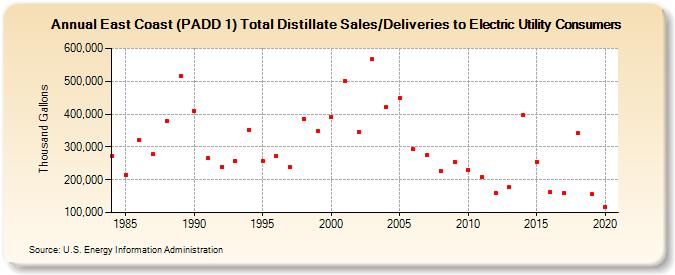
| East Coast (PADD 1) Total Distillate Sales/Deliveries to Electric Utility Consumers (Thousand Gallons) | |||||
| Decade | Year-0 | Year-1 | Year-2 | Year-3 | Year-4 | Year-5 | Year-6 | Year-7 | Year-8 | Year-9 |
|---|---|---|---|---|---|---|---|---|---|---|
| 1980's | 270,776 | 215,156 | 320,566 | 276,980 | 378,314 | 516,159 | ||||
| 1990's | 409,709 | 265,861 | 239,921 | 258,181 | 352,870 | 257,997 | 272,879 | 238,989 | 386,452 | 349,863 |
| 2000's | 389,981 | 501,708 | 345,651 | 567,598 | 420,016 | 450,151 | 292,216 | 276,242 | 228,074 | 254,207 |
| 2010's | 230,926 | 207,643 | 160,642 | 177,818 | 395,695 | 254,677 | 162,786 | 158,087 | 340,927 | 155,195 |
| 2020's | 118,453 |
| - = No Data Reported; -- = Not Applicable; NA = Not Available; W = Withheld to avoid disclosure of individual company data. |
| Release Date: 2/9/2022 |
| Next Release Date: Suspended |