|
Download Data (XLS File) |
|
|||||
|
|||||
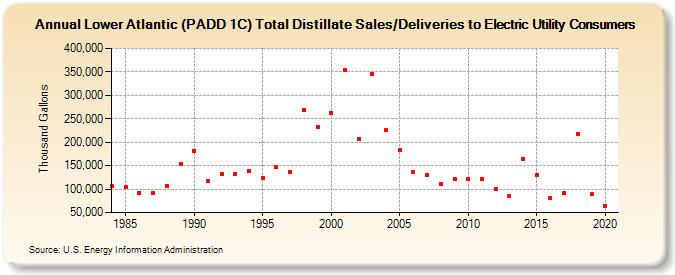
| Lower Atlantic (PADD 1C) Total Distillate Sales/Deliveries to Electric Utility Consumers (Thousand Gallons) | |||||
| Decade | Year-0 | Year-1 | Year-2 | Year-3 | Year-4 | Year-5 | Year-6 | Year-7 | Year-8 | Year-9 |
|---|---|---|---|---|---|---|---|---|---|---|
| 1980's | 106,362 | 104,601 | 92,475 | 91,854 | 107,323 | 153,389 | ||||
| 1990's | 182,134 | 117,962 | 133,020 | 132,195 | 139,664 | 123,266 | 146,815 | 135,579 | 268,153 | 233,252 |
| 2000's | 262,903 | 353,413 | 207,488 | 346,330 | 224,956 | 183,048 | 136,028 | 130,726 | 111,504 | 120,612 |
| 2010's | 122,105 | 121,317 | 99,610 | 84,630 | 164,884 | 129,780 | 81,787 | 91,882 | 217,176 | 89,020 |
| 2020's | 62,952 |
| - = No Data Reported; -- = Not Applicable; NA = Not Available; W = Withheld to avoid disclosure of individual company data. |
| Release Date: 2/9/2022 |
| Next Release Date: Suspended |