|
Download Data (XLS File) |
|
|||||
|
|||||
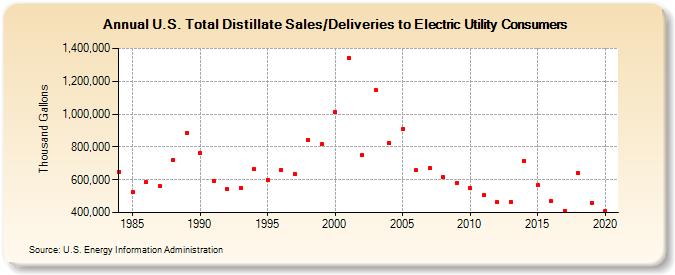
| U.S. Total Distillate Sales/Deliveries to Electric Utility Consumers (Thousand Gallons) | |||||
| Decade | Year-0 | Year-1 | Year-2 | Year-3 | Year-4 | Year-5 | Year-6 | Year-7 | Year-8 | Year-9 |
|---|---|---|---|---|---|---|---|---|---|---|
| 1980's | 648,665 | 523,010 | 583,579 | 562,665 | 720,137 | 887,599 | ||||
| 1990's | 763,709 | 594,821 | 540,683 | 550,752 | 663,814 | 597,461 | 657,881 | 636,002 | 840,731 | 816,008 |
| 2000's | 1,015,100 | 1,343,761 | 750,557 | 1,147,727 | 823,380 | 906,976 | 656,355 | 669,951 | 615,525 | 581,386 |
| 2010's | 548,144 | 506,603 | 461,694 | 465,334 | 717,043 | 565,337 | 469,716 | 411,317 | 640,935 | 460,956 |
| 2020's | 411,514 |
| - = No Data Reported; -- = Not Applicable; NA = Not Available; W = Withheld to avoid disclosure of individual company data. |
| Release Date: 2/9/2022 |
| Next Release Date: Suspended |