|
Download Data (XLS File) |
|
|||||
|
|||||
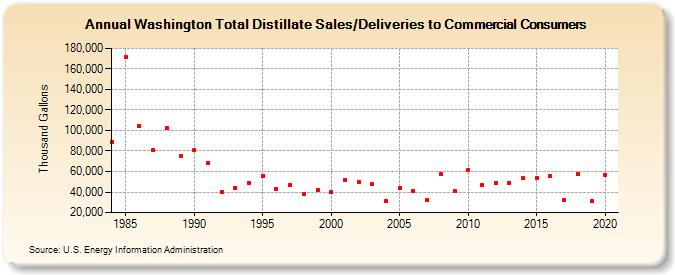
| Washington Total Distillate Sales/Deliveries to Commercial Consumers (Thousand Gallons) | |||||
| Decade | Year-0 | Year-1 | Year-2 | Year-3 | Year-4 | Year-5 | Year-6 | Year-7 | Year-8 | Year-9 |
|---|---|---|---|---|---|---|---|---|---|---|
| 1980's | 88,779 | 171,185 | 104,201 | 81,421 | 102,560 | 75,037 | ||||
| 1990's | 80,815 | 68,004 | 40,332 | 43,660 | 48,979 | 55,812 | 42,990 | 47,301 | 37,606 | 42,150 |
| 2000's | 39,648 | 51,289 | 49,915 | 47,587 | 31,260 | 43,584 | 41,496 | 32,317 | 57,460 | 41,467 |
| 2010's | 61,716 | 46,945 | 48,736 | 48,827 | 53,405 | 54,067 | 55,833 | 32,056 | 57,950 | 31,353 |
| 2020's | 57,083 |
| - = No Data Reported; -- = Not Applicable; NA = Not Available; W = Withheld to avoid disclosure of individual company data. |
| Release Date: 2/9/2022 |
| Next Release Date: Suspended |