|
Download Data (XLS File) |
|
|||||
|
|||||
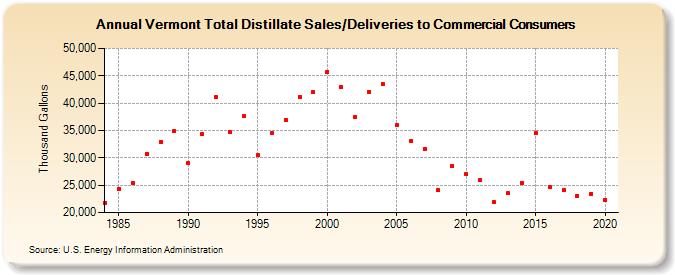
| Vermont Total Distillate Sales/Deliveries to Commercial Consumers (Thousand Gallons) | |||||
| Decade | Year-0 | Year-1 | Year-2 | Year-3 | Year-4 | Year-5 | Year-6 | Year-7 | Year-8 | Year-9 |
|---|---|---|---|---|---|---|---|---|---|---|
| 1980's | 21,824 | 24,371 | 25,431 | 30,702 | 32,970 | 34,865 | ||||
| 1990's | 28,992 | 34,371 | 41,119 | 34,691 | 37,586 | 30,554 | 34,575 | 36,962 | 41,201 | 41,941 |
| 2000's | 45,742 | 42,986 | 37,377 | 42,038 | 43,414 | 36,012 | 33,120 | 31,598 | 24,098 | 28,579 |
| 2010's | 26,998 | 25,914 | 21,910 | 23,556 | 25,484 | 34,452 | 24,620 | 24,119 | 23,092 | 23,472 |
| 2020's | 22,351 |
| - = No Data Reported; -- = Not Applicable; NA = Not Available; W = Withheld to avoid disclosure of individual company data. |
| Release Date: 2/9/2022 |
| Next Release Date: Suspended |