|
Download Data (XLS File) |
|
|||||
|
|||||
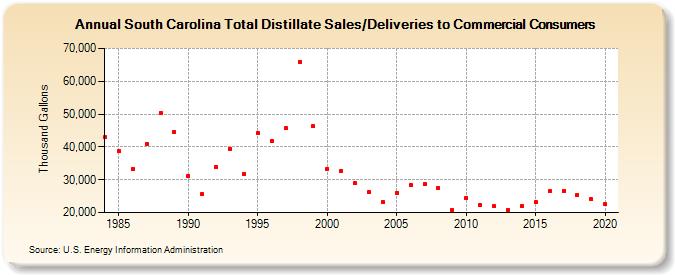
| South Carolina Total Distillate Sales/Deliveries to Commercial Consumers (Thousand Gallons) | |||||
| Decade | Year-0 | Year-1 | Year-2 | Year-3 | Year-4 | Year-5 | Year-6 | Year-7 | Year-8 | Year-9 |
|---|---|---|---|---|---|---|---|---|---|---|
| 1980's | 42,933 | 38,702 | 33,216 | 40,884 | 50,337 | 44,673 | ||||
| 1990's | 31,240 | 25,659 | 33,825 | 39,475 | 31,802 | 44,260 | 41,888 | 45,646 | 65,974 | 46,250 |
| 2000's | 33,356 | 32,766 | 28,900 | 26,132 | 23,155 | 26,080 | 28,304 | 28,558 | 27,511 | 20,837 |
| 2010's | 24,438 | 22,229 | 21,892 | 20,678 | 21,940 | 23,163 | 26,455 | 26,652 | 25,409 | 24,006 |
| 2020's | 22,497 |
| - = No Data Reported; -- = Not Applicable; NA = Not Available; W = Withheld to avoid disclosure of individual company data. |
| Release Date: 2/9/2022 |
| Next Release Date: Suspended |