|
Download Data (XLS File) |
|
|||||
|
|||||
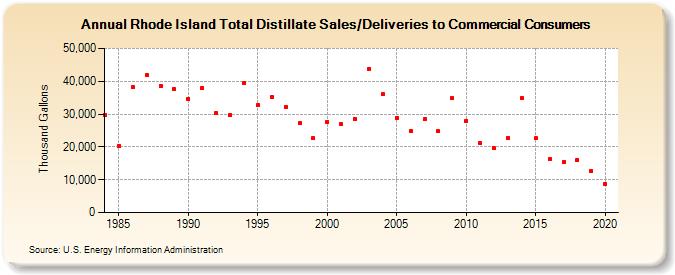
| Rhode Island Total Distillate Sales/Deliveries to Commercial Consumers (Thousand Gallons) | |||||
| Decade | Year-0 | Year-1 | Year-2 | Year-3 | Year-4 | Year-5 | Year-6 | Year-7 | Year-8 | Year-9 |
|---|---|---|---|---|---|---|---|---|---|---|
| 1980's | 29,795 | 20,309 | 38,158 | 41,941 | 38,557 | 37,598 | ||||
| 1990's | 34,645 | 38,076 | 30,374 | 29,733 | 39,492 | 32,722 | 35,127 | 32,287 | 27,225 | 22,593 |
| 2000's | 27,642 | 26,835 | 28,618 | 43,729 | 35,993 | 28,802 | 24,844 | 28,361 | 24,752 | 34,745 |
| 2010's | 27,984 | 21,136 | 19,533 | 22,638 | 34,961 | 22,595 | 16,299 | 15,455 | 16,064 | 12,629 |
| 2020's | 8,701 |
| - = No Data Reported; -- = Not Applicable; NA = Not Available; W = Withheld to avoid disclosure of individual company data. |
| Release Date: 2/9/2022 |
| Next Release Date: Suspended |