|
Download Data (XLS File) |
|
|||||
|
|||||
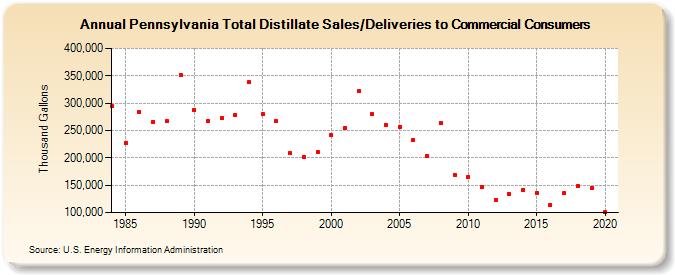
| Pennsylvania Total Distillate Sales/Deliveries to Commercial Consumers (Thousand Gallons) | |||||
| Decade | Year-0 | Year-1 | Year-2 | Year-3 | Year-4 | Year-5 | Year-6 | Year-7 | Year-8 | Year-9 |
|---|---|---|---|---|---|---|---|---|---|---|
| 1980's | 294,601 | 226,983 | 284,096 | 266,014 | 266,630 | 352,203 | ||||
| 1990's | 287,752 | 267,618 | 272,669 | 278,990 | 337,709 | 279,727 | 267,409 | 209,123 | 201,905 | 210,691 |
| 2000's | 241,656 | 255,353 | 322,007 | 279,624 | 260,457 | 257,038 | 232,550 | 202,934 | 264,183 | 169,531 |
| 2010's | 165,463 | 146,108 | 123,163 | 133,524 | 141,796 | 135,844 | 113,472 | 135,120 | 148,783 | 145,593 |
| 2020's | 101,371 |
| - = No Data Reported; -- = Not Applicable; NA = Not Available; W = Withheld to avoid disclosure of individual company data. |
| Release Date: 2/9/2022 |
| Next Release Date: Suspended |