|
Download Data (XLS File) |
|
|||||
|
|||||
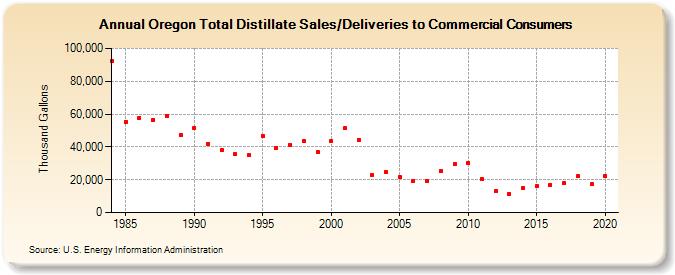
| Oregon Total Distillate Sales/Deliveries to Commercial Consumers (Thousand Gallons) | |||||
| Decade | Year-0 | Year-1 | Year-2 | Year-3 | Year-4 | Year-5 | Year-6 | Year-7 | Year-8 | Year-9 |
|---|---|---|---|---|---|---|---|---|---|---|
| 1980's | 92,510 | 55,442 | 57,789 | 56,649 | 58,974 | 47,226 | ||||
| 1990's | 51,677 | 41,992 | 37,929 | 35,455 | 34,820 | 46,877 | 39,596 | 41,385 | 43,671 | 36,968 |
| 2000's | 43,705 | 51,301 | 44,367 | 22,911 | 24,819 | 21,658 | 19,437 | 19,438 | 25,282 | 29,348 |
| 2010's | 30,052 | 20,721 | 12,851 | 11,603 | 14,845 | 16,050 | 17,026 | 17,774 | 22,004 | 17,193 |
| 2020's | 22,402 |
| - = No Data Reported; -- = Not Applicable; NA = Not Available; W = Withheld to avoid disclosure of individual company data. |
| Release Date: 2/9/2022 |
| Next Release Date: Suspended |