|
Download Data (XLS File) |
|
|||||
|
|||||
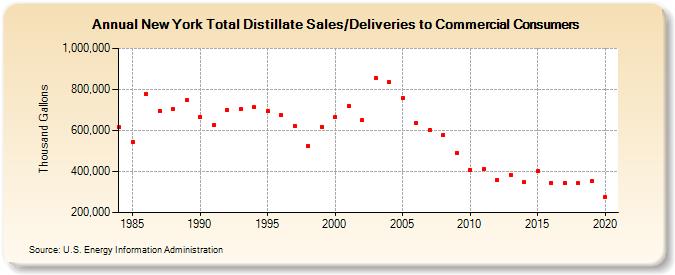
| New York Total Distillate Sales/Deliveries to Commercial Consumers (Thousand Gallons) | |||||
| Decade | Year-0 | Year-1 | Year-2 | Year-3 | Year-4 | Year-5 | Year-6 | Year-7 | Year-8 | Year-9 |
|---|---|---|---|---|---|---|---|---|---|---|
| 1980's | 615,610 | 544,597 | 779,376 | 696,080 | 702,709 | 746,919 | ||||
| 1990's | 668,051 | 626,457 | 700,658 | 703,095 | 712,524 | 693,853 | 675,093 | 623,764 | 523,270 | 618,531 |
| 2000's | 665,223 | 718,463 | 649,354 | 856,394 | 834,103 | 759,080 | 636,199 | 602,467 | 577,187 | 491,536 |
| 2010's | 406,474 | 413,088 | 357,669 | 383,177 | 347,386 | 401,843 | 346,253 | 344,687 | 341,888 | 351,639 |
| 2020's | 274,016 |
| - = No Data Reported; -- = Not Applicable; NA = Not Available; W = Withheld to avoid disclosure of individual company data. |
| Release Date: 2/9/2022 |
| Next Release Date: Suspended |