|
Download Data (XLS File) |
|
|||||
|
|||||
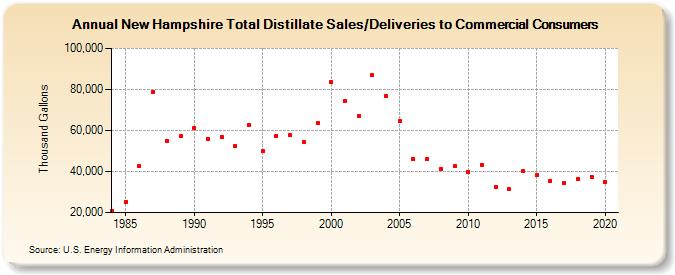
| New Hampshire Total Distillate Sales/Deliveries to Commercial Consumers (Thousand Gallons) | |||||
| Decade | Year-0 | Year-1 | Year-2 | Year-3 | Year-4 | Year-5 | Year-6 | Year-7 | Year-8 | Year-9 |
|---|---|---|---|---|---|---|---|---|---|---|
| 1980's | 20,873 | 25,324 | 42,455 | 78,890 | 55,055 | 57,275 | ||||
| 1990's | 61,309 | 55,978 | 56,911 | 52,216 | 62,453 | 49,849 | 57,387 | 57,654 | 54,240 | 63,626 |
| 2000's | 83,702 | 74,362 | 66,826 | 86,934 | 76,897 | 64,545 | 46,232 | 45,883 | 41,254 | 42,557 |
| 2010's | 39,671 | 43,292 | 32,389 | 31,293 | 40,070 | 38,127 | 35,300 | 34,530 | 36,457 | 37,534 |
| 2020's | 34,787 |
| - = No Data Reported; -- = Not Applicable; NA = Not Available; W = Withheld to avoid disclosure of individual company data. |
| Release Date: 2/9/2022 |
| Next Release Date: Suspended |