|
Download Data (XLS File) |
|
|||||
|
|||||
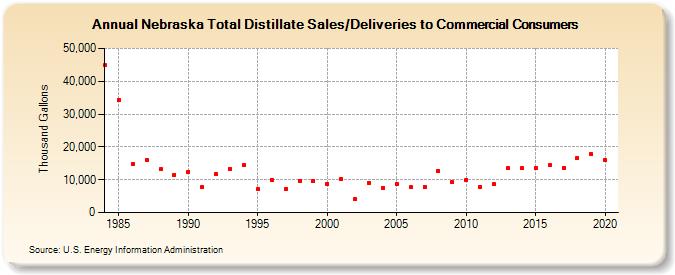
| Nebraska Total Distillate Sales/Deliveries to Commercial Consumers (Thousand Gallons) | |||||
| Decade | Year-0 | Year-1 | Year-2 | Year-3 | Year-4 | Year-5 | Year-6 | Year-7 | Year-8 | Year-9 |
|---|---|---|---|---|---|---|---|---|---|---|
| 1980's | 44,828 | 34,230 | 14,857 | 16,066 | 13,128 | 11,519 | ||||
| 1990's | 12,448 | 7,743 | 11,604 | 13,368 | 14,475 | 7,138 | 10,015 | 7,178 | 9,736 | 9,702 |
| 2000's | 8,700 | 10,356 | 3,991 | 9,153 | 7,613 | 8,627 | 7,703 | 7,793 | 12,677 | 9,245 |
| 2010's | 9,936 | 7,916 | 8,558 | 13,489 | 13,509 | 13,562 | 14,368 | 13,721 | 16,548 | 17,814 |
| 2020's | 16,014 |
| - = No Data Reported; -- = Not Applicable; NA = Not Available; W = Withheld to avoid disclosure of individual company data. |
| Release Date: 2/9/2022 |
| Next Release Date: Suspended |