|
Download Data (XLS File) |
|
|||||
|
|||||
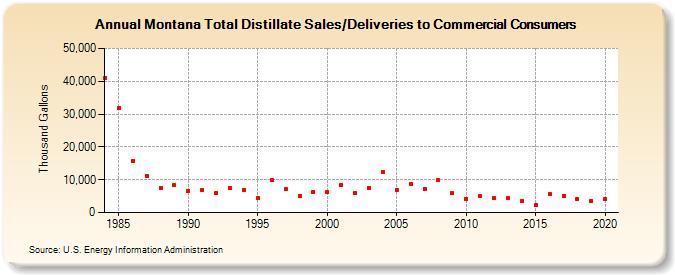
| Montana Total Distillate Sales/Deliveries to Commercial Consumers (Thousand Gallons) | |||||
| Decade | Year-0 | Year-1 | Year-2 | Year-3 | Year-4 | Year-5 | Year-6 | Year-7 | Year-8 | Year-9 |
|---|---|---|---|---|---|---|---|---|---|---|
| 1980's | 41,020 | 31,831 | 15,852 | 11,218 | 7,551 | 8,343 | ||||
| 1990's | 6,681 | 6,958 | 6,066 | 7,429 | 6,999 | 4,501 | 9,941 | 7,038 | 5,005 | 6,295 |
| 2000's | 6,271 | 8,381 | 5,935 | 7,469 | 12,337 | 6,840 | 8,768 | 7,207 | 9,828 | 5,928 |
| 2010's | 4,227 | 4,936 | 4,425 | 4,341 | 3,514 | 2,216 | 5,514 | 5,045 | 4,042 | 3,664 |
| 2020's | 4,175 |
| - = No Data Reported; -- = Not Applicable; NA = Not Available; W = Withheld to avoid disclosure of individual company data. |
| Release Date: 2/9/2022 |
| Next Release Date: Suspended |