|
Download Data (XLS File) |
|
|||||
|
|||||
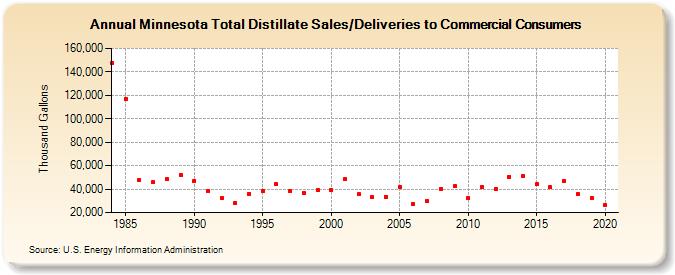
| Minnesota Total Distillate Sales/Deliveries to Commercial Consumers (Thousand Gallons) | |||||
| Decade | Year-0 | Year-1 | Year-2 | Year-3 | Year-4 | Year-5 | Year-6 | Year-7 | Year-8 | Year-9 |
|---|---|---|---|---|---|---|---|---|---|---|
| 1980's | 147,548 | 117,257 | 48,120 | 45,757 | 48,378 | 52,285 | ||||
| 1990's | 47,303 | 38,515 | 32,674 | 28,557 | 36,107 | 38,052 | 44,055 | 38,002 | 37,007 | 39,409 |
| 2000's | 39,077 | 48,292 | 35,459 | 32,906 | 33,688 | 42,039 | 27,141 | 29,998 | 40,022 | 42,593 |
| 2010's | 32,685 | 41,977 | 40,235 | 50,596 | 51,116 | 43,968 | 41,514 | 46,943 | 35,897 | 32,577 |
| 2020's | 26,259 |
| - = No Data Reported; -- = Not Applicable; NA = Not Available; W = Withheld to avoid disclosure of individual company data. |
| Release Date: 2/9/2022 |
| Next Release Date: Suspended |