|
Download Data (XLS File) |
|
|||||
|
|||||
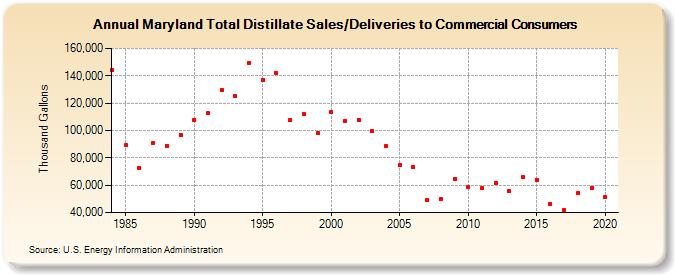
| Maryland Total Distillate Sales/Deliveries to Commercial Consumers (Thousand Gallons) | |||||
| Decade | Year-0 | Year-1 | Year-2 | Year-3 | Year-4 | Year-5 | Year-6 | Year-7 | Year-8 | Year-9 |
|---|---|---|---|---|---|---|---|---|---|---|
| 1980's | 143,933 | 89,377 | 72,933 | 91,099 | 88,871 | 96,750 | ||||
| 1990's | 107,876 | 112,806 | 129,816 | 124,999 | 149,545 | 136,795 | 142,124 | 107,936 | 112,219 | 98,107 |
| 2000's | 113,525 | 107,053 | 107,941 | 99,564 | 88,334 | 74,901 | 73,461 | 49,023 | 49,910 | 64,892 |
| 2010's | 58,497 | 57,687 | 61,549 | 55,921 | 65,740 | 64,033 | 46,476 | 41,979 | 54,251 | 58,179 |
| 2020's | 51,022 |
| - = No Data Reported; -- = Not Applicable; NA = Not Available; W = Withheld to avoid disclosure of individual company data. |
| Release Date: 2/9/2022 |
| Next Release Date: Suspended |