|
Download Data (XLS File) |
|
|||||
|
|||||
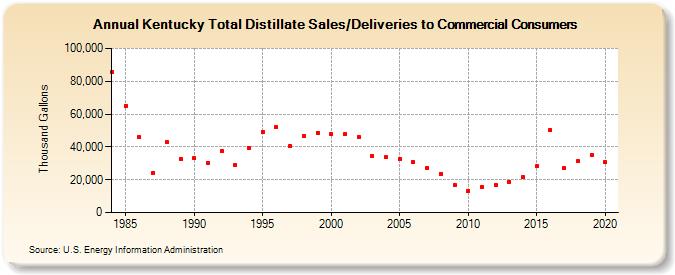
| Kentucky Total Distillate Sales/Deliveries to Commercial Consumers (Thousand Gallons) | |||||
| Decade | Year-0 | Year-1 | Year-2 | Year-3 | Year-4 | Year-5 | Year-6 | Year-7 | Year-8 | Year-9 |
|---|---|---|---|---|---|---|---|---|---|---|
| 1980's | 85,382 | 65,076 | 45,760 | 24,198 | 42,848 | 32,845 | ||||
| 1990's | 33,039 | 30,283 | 37,771 | 28,965 | 39,505 | 49,179 | 51,855 | 40,640 | 46,496 | 48,643 |
| 2000's | 47,585 | 47,825 | 46,117 | 34,155 | 33,677 | 32,432 | 30,542 | 27,247 | 23,683 | 16,676 |
| 2010's | 13,378 | 15,664 | 16,683 | 18,745 | 21,473 | 28,136 | 50,390 | 27,119 | 31,142 | 35,228 |
| 2020's | 30,587 |
| - = No Data Reported; -- = Not Applicable; NA = Not Available; W = Withheld to avoid disclosure of individual company data. |
| Release Date: 2/9/2022 |
| Next Release Date: Suspended |