|
Download Data (XLS File) |
|
|||||
|
|||||
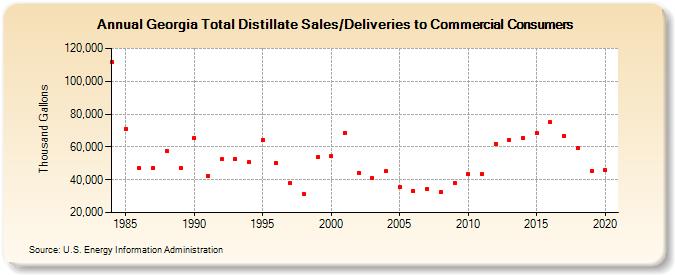
| Georgia Total Distillate Sales/Deliveries to Commercial Consumers (Thousand Gallons) | |||||
| Decade | Year-0 | Year-1 | Year-2 | Year-3 | Year-4 | Year-5 | Year-6 | Year-7 | Year-8 | Year-9 |
|---|---|---|---|---|---|---|---|---|---|---|
| 1980's | 111,548 | 71,131 | 46,952 | 47,271 | 57,417 | 47,056 | ||||
| 1990's | 65,424 | 42,347 | 52,325 | 52,701 | 50,550 | 64,164 | 50,243 | 37,797 | 31,440 | 53,713 |
| 2000's | 54,421 | 68,643 | 44,344 | 40,750 | 45,141 | 35,404 | 33,161 | 34,434 | 32,392 | 37,991 |
| 2010's | 43,375 | 43,551 | 61,887 | 64,394 | 65,602 | 68,236 | 74,861 | 66,816 | 59,243 | 45,590 |
| 2020's | 45,891 |
| - = No Data Reported; -- = Not Applicable; NA = Not Available; W = Withheld to avoid disclosure of individual company data. |
| Release Date: 2/9/2022 |
| Next Release Date: Suspended |