|
Download Data (XLS File) |
|
|||||
|
|||||
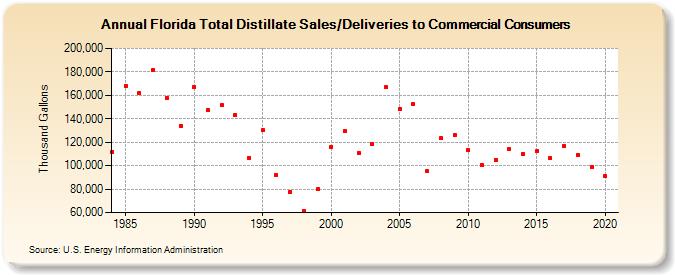
| Florida Total Distillate Sales/Deliveries to Commercial Consumers (Thousand Gallons) | |||||
| Decade | Year-0 | Year-1 | Year-2 | Year-3 | Year-4 | Year-5 | Year-6 | Year-7 | Year-8 | Year-9 |
|---|---|---|---|---|---|---|---|---|---|---|
| 1980's | 111,742 | 168,264 | 161,785 | 181,763 | 158,091 | 134,121 | ||||
| 1990's | 166,978 | 147,334 | 151,354 | 143,038 | 106,951 | 130,013 | 92,167 | 77,682 | 61,163 | 79,859 |
| 2000's | 116,117 | 129,360 | 110,928 | 118,717 | 166,747 | 148,640 | 152,182 | 95,117 | 123,366 | 126,292 |
| 2010's | 113,313 | 100,791 | 104,860 | 113,873 | 110,082 | 112,084 | 106,512 | 116,624 | 109,290 | 98,884 |
| 2020's | 91,323 |
| - = No Data Reported; -- = Not Applicable; NA = Not Available; W = Withheld to avoid disclosure of individual company data. |
| Release Date: 2/9/2022 |
| Next Release Date: Suspended |