|
Download Data (XLS File) |
|
|||||
|
|||||
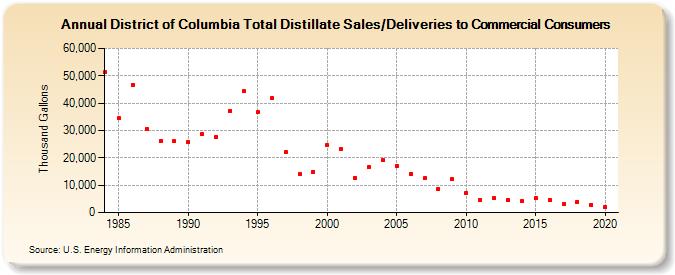
| District of Columbia Total Distillate Sales/Deliveries to Commercial Consumers (Thousand Gallons) | |||||
| Decade | Year-0 | Year-1 | Year-2 | Year-3 | Year-4 | Year-5 | Year-6 | Year-7 | Year-8 | Year-9 |
|---|---|---|---|---|---|---|---|---|---|---|
| 1980's | 51,254 | 34,457 | 46,716 | 30,575 | 26,124 | 26,060 | ||||
| 1990's | 25,817 | 28,833 | 27,772 | 37,193 | 44,323 | 36,647 | 41,774 | 22,010 | 13,976 | 14,860 |
| 2000's | 24,683 | 23,065 | 12,778 | 16,566 | 19,168 | 16,943 | 14,210 | 12,537 | 8,646 | 12,177 |
| 2010's | 7,322 | 4,685 | 5,306 | 4,649 | 4,104 | 5,207 | 4,768 | 2,958 | 4,004 | 2,858 |
| 2020's | 1,979 |
| - = No Data Reported; -- = Not Applicable; NA = Not Available; W = Withheld to avoid disclosure of individual company data. |
| Release Date: 2/9/2022 |
| Next Release Date: Suspended |