|
Download Data (XLS File) |
|
|||||
|
|||||
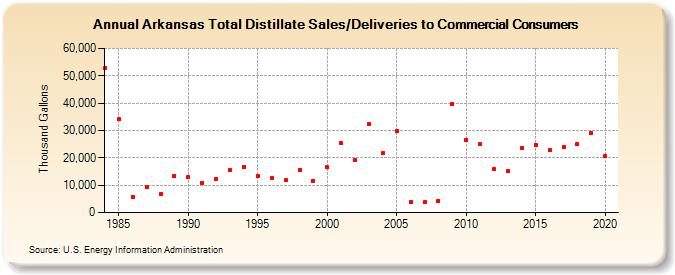
| Arkansas Total Distillate Sales/Deliveries to Commercial Consumers (Thousand Gallons) | |||||
| Decade | Year-0 | Year-1 | Year-2 | Year-3 | Year-4 | Year-5 | Year-6 | Year-7 | Year-8 | Year-9 |
|---|---|---|---|---|---|---|---|---|---|---|
| 1980's | 52,651 | 34,157 | 5,853 | 9,274 | 6,734 | 13,515 | ||||
| 1990's | 12,932 | 10,931 | 12,343 | 15,518 | 16,766 | 13,296 | 12,637 | 11,762 | 15,728 | 11,549 |
| 2000's | 16,517 | 25,278 | 19,284 | 32,207 | 21,597 | 29,986 | 3,781 | 3,718 | 4,389 | 39,716 |
| 2010's | 26,698 | 24,898 | 15,796 | 15,175 | 23,488 | 24,757 | 22,844 | 24,029 | 24,893 | 29,205 |
| 2020's | 20,492 |
| - = No Data Reported; -- = Not Applicable; NA = Not Available; W = Withheld to avoid disclosure of individual company data. |
| Release Date: 2/9/2022 |
| Next Release Date: Suspended |