|
Download Data (XLS File) |
|
|||||
|
|||||
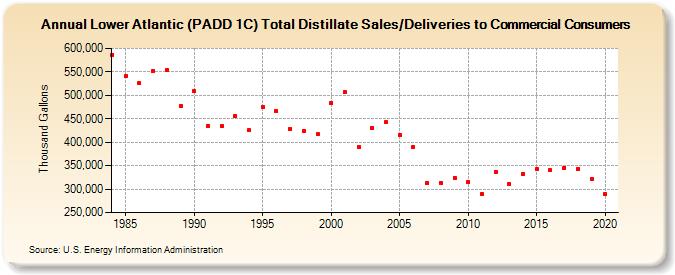
| Lower Atlantic (PADD 1C) Total Distillate Sales/Deliveries to Commercial Consumers (Thousand Gallons) | |||||
| Decade | Year-0 | Year-1 | Year-2 | Year-3 | Year-4 | Year-5 | Year-6 | Year-7 | Year-8 | Year-9 |
|---|---|---|---|---|---|---|---|---|---|---|
| 1980's | 586,460 | 540,969 | 525,752 | 551,756 | 554,355 | 476,773 | ||||
| 1990's | 508,232 | 434,871 | 434,899 | 455,819 | 425,195 | 475,081 | 466,200 | 428,725 | 424,371 | 416,807 |
| 2000's | 483,592 | 506,012 | 390,399 | 430,968 | 442,130 | 414,919 | 390,100 | 312,861 | 313,954 | 324,282 |
| 2010's | 315,966 | 290,431 | 337,377 | 311,898 | 331,947 | 342,938 | 340,035 | 345,929 | 343,021 | 321,529 |
| 2020's | 289,310 |
| - = No Data Reported; -- = Not Applicable; NA = Not Available; W = Withheld to avoid disclosure of individual company data. |
| Release Date: 2/9/2022 |
| Next Release Date: Suspended |