|
Download Data (XLS File) |
|
|||||
|
|||||
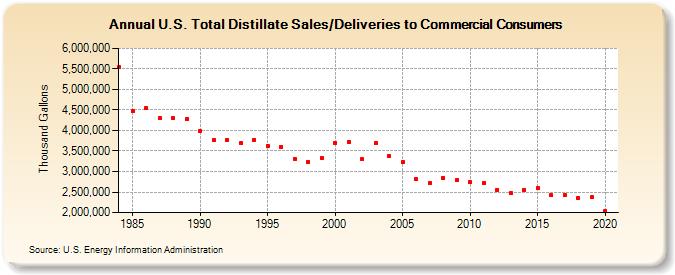
| U.S. Total Distillate Sales/Deliveries to Commercial Consumers (Thousand Gallons) | |||||
| Decade | Year-0 | Year-1 | Year-2 | Year-3 | Year-4 | Year-5 | Year-6 | Year-7 | Year-8 | Year-9 |
|---|---|---|---|---|---|---|---|---|---|---|
| 1980's | 5,538,184 | 4,463,226 | 4,542,253 | 4,299,580 | 4,294,182 | 4,277,105 | ||||
| 1990's | 3,986,624 | 3,767,833 | 3,771,021 | 3,689,509 | 3,774,929 | 3,630,856 | 3,603,620 | 3,314,956 | 3,233,350 | 3,338,242 |
| 2000's | 3,706,345 | 3,717,862 | 3,293,387 | 3,686,537 | 3,383,061 | 3,224,216 | 2,808,786 | 2,718,674 | 2,850,895 | 2,785,246 |
| 2010's | 2,738,304 | 2,715,335 | 2,557,543 | 2,471,897 | 2,543,778 | 2,601,317 | 2,416,689 | 2,428,663 | 2,359,181 | 2,383,920 |
| 2020's | 2,038,439 |
| - = No Data Reported; -- = Not Applicable; NA = Not Available; W = Withheld to avoid disclosure of individual company data. |
| Release Date: 2/9/2022 |
| Next Release Date: Suspended |