|
Download Data (XLS File) |
|
|||||
|
|||||
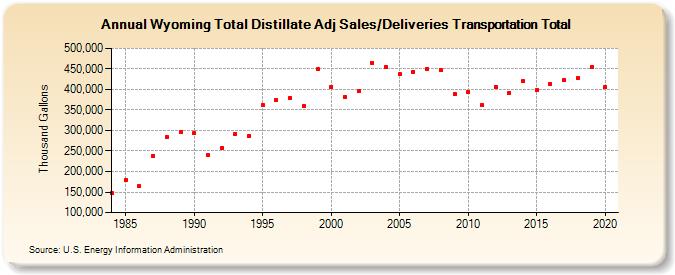
| Wyoming Total Distillate Adj Sales/Deliveries Transportation Total (Thousand Gallons) | |||||
| Decade | Year-0 | Year-1 | Year-2 | Year-3 | Year-4 | Year-5 | Year-6 | Year-7 | Year-8 | Year-9 |
|---|---|---|---|---|---|---|---|---|---|---|
| 1980's | 147,696 | 179,989 | 163,567 | 238,830 | 283,873 | 297,437 | ||||
| 1990's | 292,797 | 239,348 | 258,068 | 292,046 | 287,244 | 362,569 | 373,602 | 380,330 | 359,934 | 449,490 |
| 2000's | 406,557 | 382,130 | 395,298 | 465,498 | 455,374 | 437,248 | 442,920 | 449,784 | 446,940 | 388,474 |
| 2010's | 393,775 | 362,085 | 406,320 | 392,066 | 419,380 | 398,191 | 413,521 | 422,448 | 428,199 | 453,573 |
| 2020's | 405,438 |
| - = No Data Reported; -- = Not Applicable; NA = Not Available; W = Withheld to avoid disclosure of individual company data. |
| Release Date: 2/9/2022 |
| Next Release Date: Suspended |