|
Download Data (XLS File) |
|
|||||
|
|||||
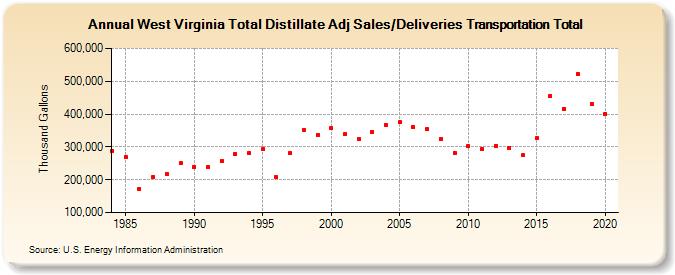
| West Virginia Total Distillate Adj Sales/Deliveries Transportation Total (Thousand Gallons) | |||||
| Decade | Year-0 | Year-1 | Year-2 | Year-3 | Year-4 | Year-5 | Year-6 | Year-7 | Year-8 | Year-9 |
|---|---|---|---|---|---|---|---|---|---|---|
| 1980's | 288,365 | 268,826 | 172,327 | 209,678 | 217,608 | 249,786 | ||||
| 1990's | 238,933 | 237,270 | 258,330 | 279,688 | 280,689 | 292,818 | 208,262 | 281,202 | 352,959 | 337,691 |
| 2000's | 356,132 | 338,706 | 325,381 | 345,781 | 367,406 | 374,496 | 360,217 | 353,437 | 324,119 | 282,594 |
| 2010's | 302,075 | 294,482 | 304,188 | 297,600 | 273,936 | 326,481 | 455,743 | 416,729 | 523,043 | 430,652 |
| 2020's | 401,486 |
| - = No Data Reported; -- = Not Applicable; NA = Not Available; W = Withheld to avoid disclosure of individual company data. |
| Release Date: 2/9/2022 |
| Next Release Date: Suspended |