|
Download Data (XLS File) |
|
|||||
|
|||||
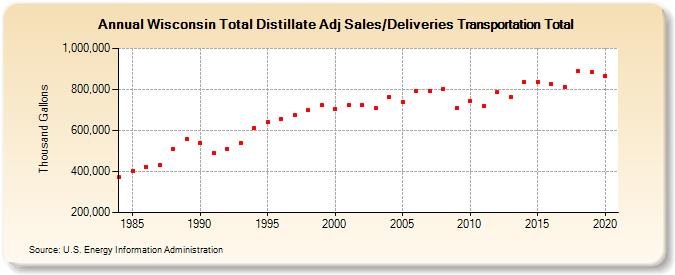
| Wisconsin Total Distillate Adj Sales/Deliveries Transportation Total (Thousand Gallons) | |||||
| Decade | Year-0 | Year-1 | Year-2 | Year-3 | Year-4 | Year-5 | Year-6 | Year-7 | Year-8 | Year-9 |
|---|---|---|---|---|---|---|---|---|---|---|
| 1980's | 372,199 | 404,817 | 423,682 | 431,427 | 507,699 | 559,075 | ||||
| 1990's | 538,731 | 489,340 | 510,067 | 539,474 | 611,286 | 640,964 | 655,416 | 673,183 | 697,547 | 722,252 |
| 2000's | 705,816 | 722,246 | 723,882 | 707,390 | 764,165 | 739,742 | 793,300 | 791,631 | 801,373 | 707,343 |
| 2010's | 745,053 | 721,399 | 785,189 | 761,735 | 838,554 | 837,992 | 825,862 | 814,186 | 887,462 | 886,002 |
| 2020's | 867,838 |
| - = No Data Reported; -- = Not Applicable; NA = Not Available; W = Withheld to avoid disclosure of individual company data. |
| Release Date: 2/9/2022 |
| Next Release Date: Suspended |