|
Download Data (XLS File) |
|
|||||
|
|||||
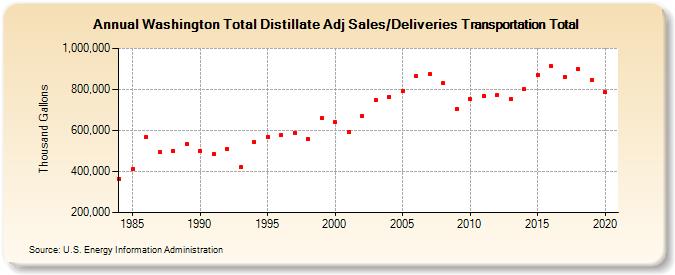
| Washington Total Distillate Adj Sales/Deliveries Transportation Total (Thousand Gallons) | |||||
| Decade | Year-0 | Year-1 | Year-2 | Year-3 | Year-4 | Year-5 | Year-6 | Year-7 | Year-8 | Year-9 |
|---|---|---|---|---|---|---|---|---|---|---|
| 1980's | 363,708 | 411,358 | 567,405 | 493,069 | 499,425 | 531,720 | ||||
| 1990's | 502,236 | 487,171 | 510,899 | 420,669 | 546,265 | 569,560 | 576,818 | 589,014 | 558,724 | 660,712 |
| 2000's | 638,931 | 593,258 | 671,315 | 748,448 | 763,503 | 791,340 | 864,415 | 873,353 | 830,153 | 704,152 |
| 2010's | 752,477 | 768,911 | 770,761 | 753,321 | 800,129 | 871,431 | 913,730 | 860,834 | 899,450 | 847,498 |
| 2020's | 785,299 |
| - = No Data Reported; -- = Not Applicable; NA = Not Available; W = Withheld to avoid disclosure of individual company data. |
| Release Date: 2/9/2022 |
| Next Release Date: Suspended |