|
Download Data (XLS File) |
|
|||||
|
|||||
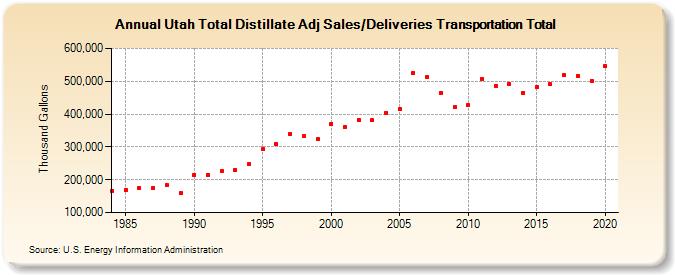
| Utah Total Distillate Adj Sales/Deliveries Transportation Total (Thousand Gallons) | |||||
| Decade | Year-0 | Year-1 | Year-2 | Year-3 | Year-4 | Year-5 | Year-6 | Year-7 | Year-8 | Year-9 |
|---|---|---|---|---|---|---|---|---|---|---|
| 1980's | 166,884 | 169,116 | 174,580 | 175,426 | 184,296 | 160,026 | ||||
| 1990's | 215,813 | 215,317 | 227,744 | 230,676 | 246,438 | 293,029 | 308,478 | 340,511 | 332,396 | 323,477 |
| 2000's | 370,636 | 360,599 | 382,304 | 380,522 | 404,275 | 415,815 | 525,576 | 512,415 | 464,448 | 420,807 |
| 2010's | 427,293 | 507,559 | 486,945 | 492,739 | 465,093 | 482,806 | 490,030 | 518,765 | 517,194 | 501,909 |
| 2020's | 545,654 |
| - = No Data Reported; -- = Not Applicable; NA = Not Available; W = Withheld to avoid disclosure of individual company data. |
| Release Date: 2/9/2022 |
| Next Release Date: Suspended |