|
Download Data (XLS File) |
|
|||||
|
|||||
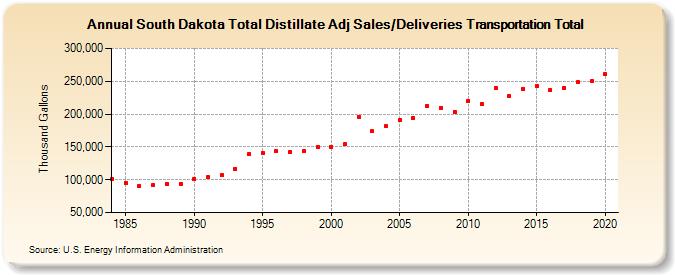
| South Dakota Total Distillate Adj Sales/Deliveries Transportation Total (Thousand Gallons) | |||||
| Decade | Year-0 | Year-1 | Year-2 | Year-3 | Year-4 | Year-5 | Year-6 | Year-7 | Year-8 | Year-9 |
|---|---|---|---|---|---|---|---|---|---|---|
| 1980's | 101,011 | 95,507 | 90,569 | 91,546 | 93,673 | 93,595 | ||||
| 1990's | 101,578 | 103,999 | 107,150 | 117,053 | 138,815 | 140,702 | 143,685 | 142,278 | 143,080 | 149,827 |
| 2000's | 150,279 | 153,914 | 195,927 | 173,644 | 181,226 | 191,708 | 194,173 | 212,036 | 209,356 | 203,753 |
| 2010's | 220,525 | 215,437 | 240,362 | 227,643 | 238,291 | 243,123 | 236,742 | 240,178 | 248,738 | 250,127 |
| 2020's | 260,550 |
| - = No Data Reported; -- = Not Applicable; NA = Not Available; W = Withheld to avoid disclosure of individual company data. |
| Release Date: 2/9/2022 |
| Next Release Date: Suspended |