|
Download Data (XLS File) |
|
|||||
|
|||||
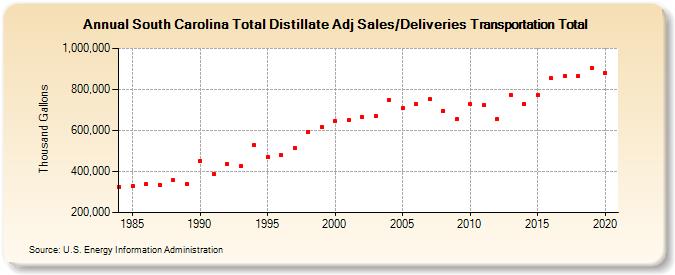
| South Carolina Total Distillate Adj Sales/Deliveries Transportation Total (Thousand Gallons) | |||||
| Decade | Year-0 | Year-1 | Year-2 | Year-3 | Year-4 | Year-5 | Year-6 | Year-7 | Year-8 | Year-9 |
|---|---|---|---|---|---|---|---|---|---|---|
| 1980's | 324,791 | 330,204 | 339,059 | 336,612 | 356,483 | 338,941 | ||||
| 1990's | 451,760 | 386,849 | 436,297 | 426,348 | 527,220 | 470,577 | 480,366 | 514,355 | 593,378 | 616,558 |
| 2000's | 645,615 | 649,813 | 665,967 | 670,178 | 750,750 | 707,698 | 726,801 | 751,994 | 695,077 | 654,296 |
| 2010's | 726,647 | 725,148 | 655,629 | 773,208 | 729,451 | 774,764 | 855,362 | 864,576 | 863,539 | 905,248 |
| 2020's | 881,536 |
| - = No Data Reported; -- = Not Applicable; NA = Not Available; W = Withheld to avoid disclosure of individual company data. |
| Release Date: 2/9/2022 |
| Next Release Date: Suspended |