|
Download Data (XLS File) |
|
|||||
|
|||||
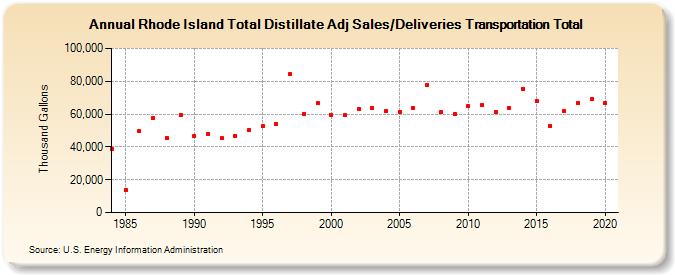
| Rhode Island Total Distillate Adj Sales/Deliveries Transportation Total (Thousand Gallons) | |||||
| Decade | Year-0 | Year-1 | Year-2 | Year-3 | Year-4 | Year-5 | Year-6 | Year-7 | Year-8 | Year-9 |
|---|---|---|---|---|---|---|---|---|---|---|
| 1980's | 38,910 | 13,670 | 49,581 | 57,733 | 45,267 | 59,362 | ||||
| 1990's | 46,523 | 48,082 | 45,181 | 46,885 | 50,145 | 52,688 | 53,955 | 84,314 | 60,319 | 66,437 |
| 2000's | 59,365 | 59,184 | 63,155 | 63,710 | 61,886 | 61,521 | 63,624 | 77,751 | 60,952 | 60,019 |
| 2010's | 64,940 | 65,441 | 61,409 | 63,660 | 75,450 | 67,842 | 52,837 | 61,619 | 66,945 | 68,960 |
| 2020's | 66,712 |
| - = No Data Reported; -- = Not Applicable; NA = Not Available; W = Withheld to avoid disclosure of individual company data. |
| Release Date: 2/9/2022 |
| Next Release Date: Suspended |