|
Download Data (XLS File) |
|
|||||
|
|||||
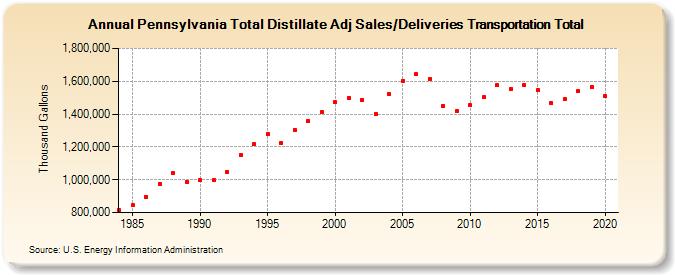
| Pennsylvania Total Distillate Adj Sales/Deliveries Transportation Total (Thousand Gallons) | |||||
| Decade | Year-0 | Year-1 | Year-2 | Year-3 | Year-4 | Year-5 | Year-6 | Year-7 | Year-8 | Year-9 |
|---|---|---|---|---|---|---|---|---|---|---|
| 1980's | 813,143 | 844,004 | 897,170 | 974,168 | 1,039,731 | 985,716 | ||||
| 1990's | 996,306 | 997,101 | 1,048,393 | 1,147,623 | 1,216,684 | 1,277,042 | 1,224,408 | 1,304,138 | 1,357,740 | 1,413,243 |
| 2000's | 1,470,462 | 1,496,517 | 1,488,637 | 1,398,079 | 1,519,523 | 1,603,199 | 1,643,807 | 1,614,463 | 1,449,470 | 1,417,669 |
| 2010's | 1,452,192 | 1,501,203 | 1,575,193 | 1,552,834 | 1,578,418 | 1,547,307 | 1,466,248 | 1,489,568 | 1,537,655 | 1,564,879 |
| 2020's | 1,508,186 |
| - = No Data Reported; -- = Not Applicable; NA = Not Available; W = Withheld to avoid disclosure of individual company data. |
| Release Date: 2/9/2022 |
| Next Release Date: Suspended |