|
Download Data (XLS File) |
|
|||||
|
|||||
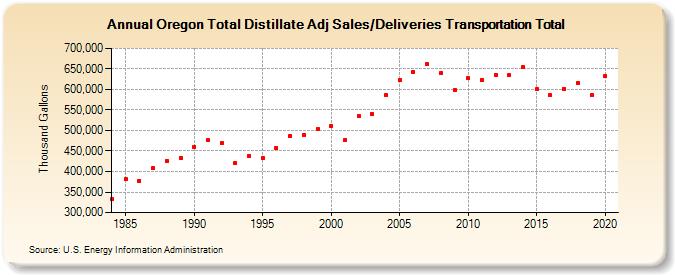
| Oregon Total Distillate Adj Sales/Deliveries Transportation Total (Thousand Gallons) | |||||
| Decade | Year-0 | Year-1 | Year-2 | Year-3 | Year-4 | Year-5 | Year-6 | Year-7 | Year-8 | Year-9 |
|---|---|---|---|---|---|---|---|---|---|---|
| 1980's | 332,174 | 380,985 | 377,984 | 407,964 | 426,706 | 432,505 | ||||
| 1990's | 460,758 | 476,116 | 469,911 | 421,157 | 437,960 | 433,915 | 456,441 | 486,997 | 489,371 | 504,012 |
| 2000's | 511,183 | 476,130 | 534,082 | 541,345 | 586,327 | 621,829 | 641,970 | 660,861 | 639,733 | 598,150 |
| 2010's | 627,014 | 624,016 | 635,731 | 635,151 | 653,492 | 600,702 | 586,336 | 602,179 | 615,817 | 587,014 |
| 2020's | 632,654 |
| - = No Data Reported; -- = Not Applicable; NA = Not Available; W = Withheld to avoid disclosure of individual company data. |
| Release Date: 2/9/2022 |
| Next Release Date: Suspended |