|
Download Data (XLS File) |
|
|||||
|
|||||
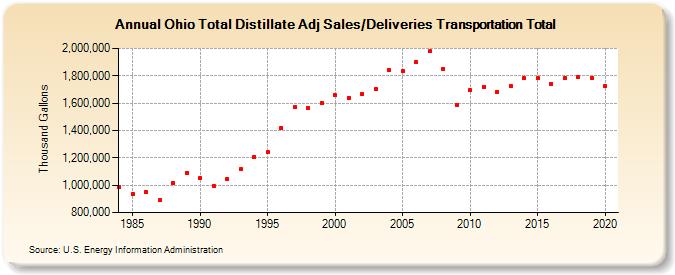
| Ohio Total Distillate Adj Sales/Deliveries Transportation Total (Thousand Gallons) | |||||
| Decade | Year-0 | Year-1 | Year-2 | Year-3 | Year-4 | Year-5 | Year-6 | Year-7 | Year-8 | Year-9 |
|---|---|---|---|---|---|---|---|---|---|---|
| 1980's | 986,284 | 937,442 | 949,442 | 889,759 | 1,017,463 | 1,092,244 | ||||
| 1990's | 1,053,300 | 997,555 | 1,047,393 | 1,116,451 | 1,208,146 | 1,239,317 | 1,419,033 | 1,572,109 | 1,560,740 | 1,600,004 |
| 2000's | 1,656,218 | 1,640,837 | 1,668,911 | 1,703,411 | 1,839,486 | 1,831,525 | 1,899,207 | 1,977,434 | 1,849,715 | 1,586,568 |
| 2010's | 1,692,341 | 1,720,093 | 1,681,241 | 1,725,595 | 1,782,411 | 1,781,506 | 1,741,977 | 1,781,935 | 1,791,445 | 1,784,936 |
| 2020's | 1,723,047 |
| - = No Data Reported; -- = Not Applicable; NA = Not Available; W = Withheld to avoid disclosure of individual company data. |
| Release Date: 2/9/2022 |
| Next Release Date: Suspended |